Visibility and Troubleshooting
This workshop has been deprecated and archived. The new Amazon EKS Workshop is now available at www.eksworkshop.com.
Getting Started
Before you go any further, please remember to type lab2 set_up in the terminal to set up the environment for this lab.
Introduction
In this lab, you will learn how Calico Enterprise makes it easy for platform engineering and development teams to gain visibility into everything that is happening from a networking perspective within your cluster, quickly diagnose issues, and understand how policies are being evaluated in real-time. The visibility that Calico Enterprise provides is a cornerstone to improving the operations of your container platform and adopting network security best practices.
You will learn the following:
- How to use the Flow Visualizer to gain visibility into existing traffic flows within the cluster and quickly identify sources of denied traffic
- How to use the Policy Board and Policy Editor to understand how policies are being evaluated in real-time across Policy Tiers
- How to use network Flow Logs to look “under the hood” of your cluster and get a detailed view into how workloads are communicating with all of Kubernetes context to troubleshoot and diagnose issues
Setup
For this lab, we will be using a fairly simple microservices application called storefront to understand the visibility and troubleshooting features of Calico Enterprise - if you are already familiar with storefront from another lab then you may want to skip to the next section.
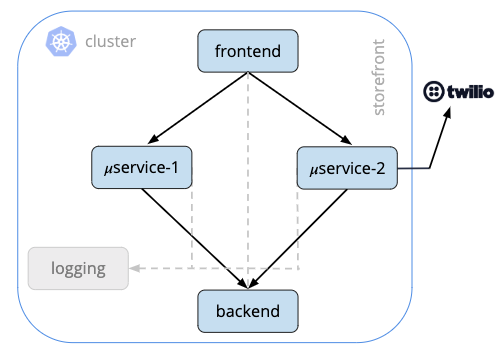
Storefront (Fig 1) is a fairly simple microservices application running in Kubernetes. It has a frontend service that handles end-user requests, communicates with two business logic services which in turn make requests to a backend service. All of these containers communicate with a logging service and one of the business logic services, microservice 2, makes external requests to Twilio to provide some telephony for this application.
Let’s quickly take a look at the pods running in the storefront namespace that are using to run these microservices:
kubectl get pods -n storefront

NAME                             READY   STATUS    RESTARTS   AGE
backend-6cfbdd589f-xxlkn         2/2     Running   0          22h
frontend-864f4fcdfd-2hhv4        4/4     Running   0          22h
logging-684747d7cd-bbjwx         1/1     Running   0          22h
microservice1-794cf77b9d-c27qr   4/4     Running   0          22h
microservice2-7bb79d9f4f-f7h6f   5/5     Running   0          22h
Using the Flow Visualizer
Next, let’s login to the Calico Enterprise UI and use the Flow Visualizer to understand how these services are communicating with each other. Login to Calico Enterprise and select the Flow Visualizer from the left navigation menu
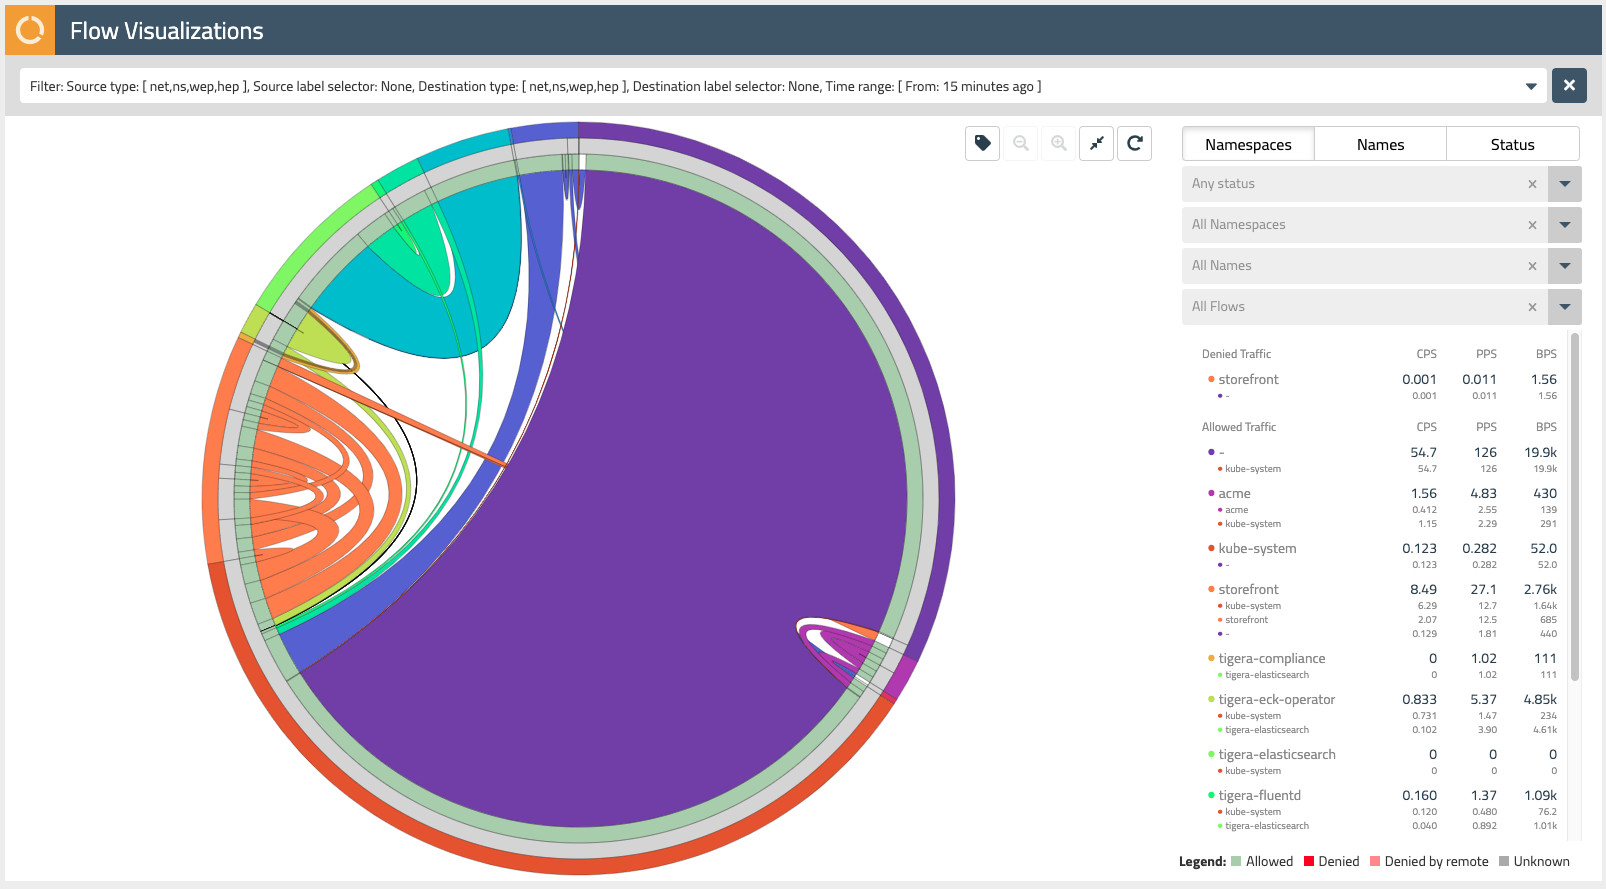
The Flow Visualizer is a powerful tool to gain visibility into network traffic within the cluster and troubleshoot issues. We will look at several different views that the Flow Visualizer provides to understand traffic flows between cluster endpoints that are represented in a circle. Traffic flows are represented as arcs within this circle and the thickness of each arc represents the volume of traffic for that flow.
Namespace View
The default view for the Flow Visualizer is the namespaces view. In this view, the different colors of the Flow Visualizer represent traffic from different namespaces. The outer ring of the Flow Visualizer can be used to select the various namespaces within our cluster. Mousing over each subsection, you’ll see the name of the namespace appear in the dropdown filters on the right-hand side.
- Find the storefront namespace in the outer ring and select it, then use the magnifying glass button in the upper right to zoom in on these network flows.
- Mousing over subsections of the next inner ring (grey), you will see the pod prefixes for each of the microservices that make up our storefront application. Note that Calico Enterprise aggregates network flows so it is easy to make sense of traffic in your cluster that may be backed by Kubernetes resources like replica sets.
The innermost ring in the Flow Visualizer allows you to select specific network flows that are associated with each of our storefront microservices. Mousing over each subsection, you will see each of these flows on the right-hand side dropdown - these should correspond to the diagram at the beginning of this lab (Fig 1).
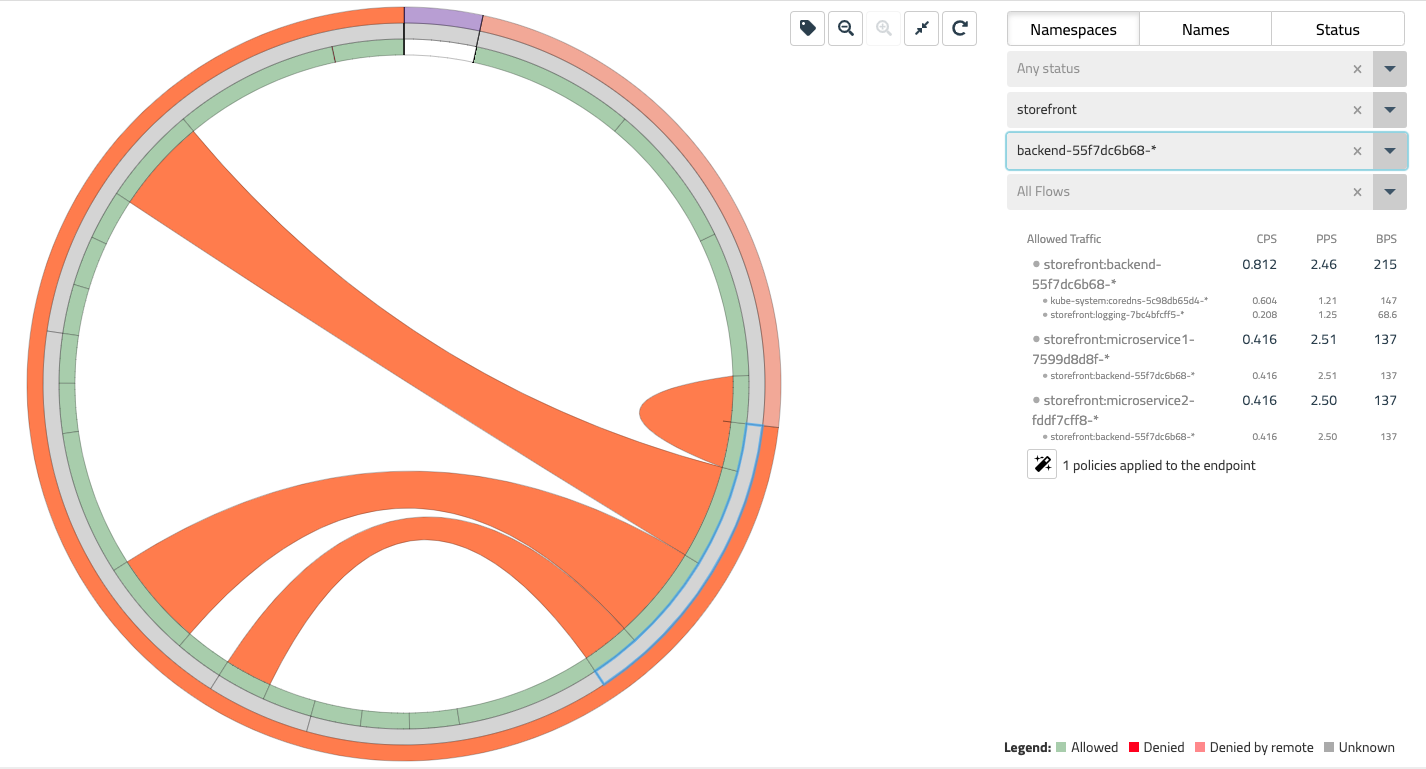
Names View
The names view is nearly identical to the namespaces view except that each color within the Flow Visualizer represents different pod prefix names within your cluster. Used in combination with namespace and other filters, this view can be helpful in diagnosing issues within a specific application.
Status View
The status view differs from other views for the Flow Visualizer in that it only represents flows in two colors - green for allowed traffic and red for denied traffic. The status view is the best way to quickly identify the source of denied traffic that may be unexpected in a dev, test, or production cluster.
- Let’s see this view in action with a simple example. Run the command lab2 deploy_rogue in your which will deploy a new pod into the cluster. This pod could represent any number of issues within your environment - a misconfiguration or something that went wrong in your CI/CD pipeline, or something that may be indicative of a compromise.
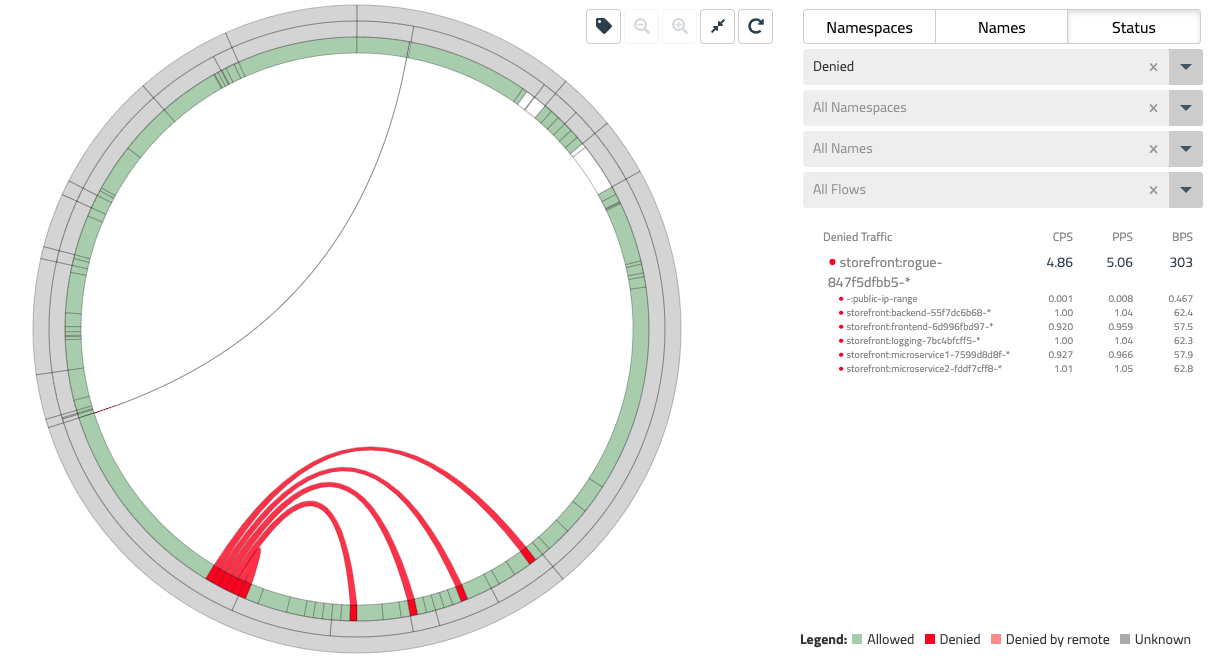
Coming back to the flow visualizer in the status view, you should start to see some denied traffic represented as red flows as the rogue pod begins to reach out to various endpoints within the storefront application.
- Use the right-hand filter to select Status = Denied to view only these flows, and then mouse over the middle ring to the specific endpoints involved in each of these flows.
Filtering
The Flow Visualizer can be used in combination with useful filtering capabilities. In addition to some of the drop-down filters we just used in the last section, there are additional filtering capabilities in the top filter bar.
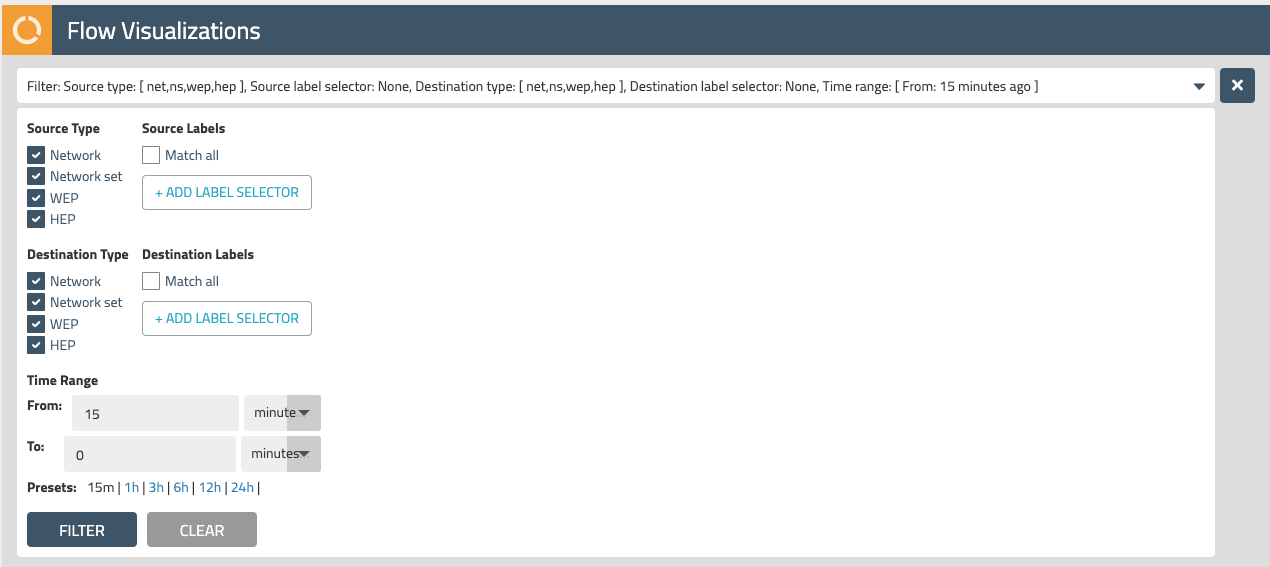
Explore the top filter bar and understand the effects of different filters for time range, source and destination labels, and different endpoint types.
Endpoint types include the following:
- Network - public and private IP addresses
- Network Set - Calico resources that allows you to abstract long lists of IPs, domains, CIDR ranges, etc. with labels (which can also be used in Calico network policies)
- HEP - host endpoints that use host networking
- WEP - workload endpoints; VMs and pods that use virtual networking
Using the Policy Board
Now that we have a better understanding of the microservices that make up our storefront application and how they are communicating with each other, let’s take a look at another tool that can provide a useful way to understand how policies are being evaluated on these network flows - the Policy Board.
Policy Tiers
Calico Enterprise makes it easy to define the “guard rails” for your Kubernetes platform through the use of Policy Tiers. Policy Tiers allow platform engineering and security teams to enforce network policies that take precedence over those defined for specific applications like storefront.
Return to the Calico Enterprise UI and select Policies from the left navigation menu. Here you will see all of the network policies defined within the cluster and how they map to policy tiers.
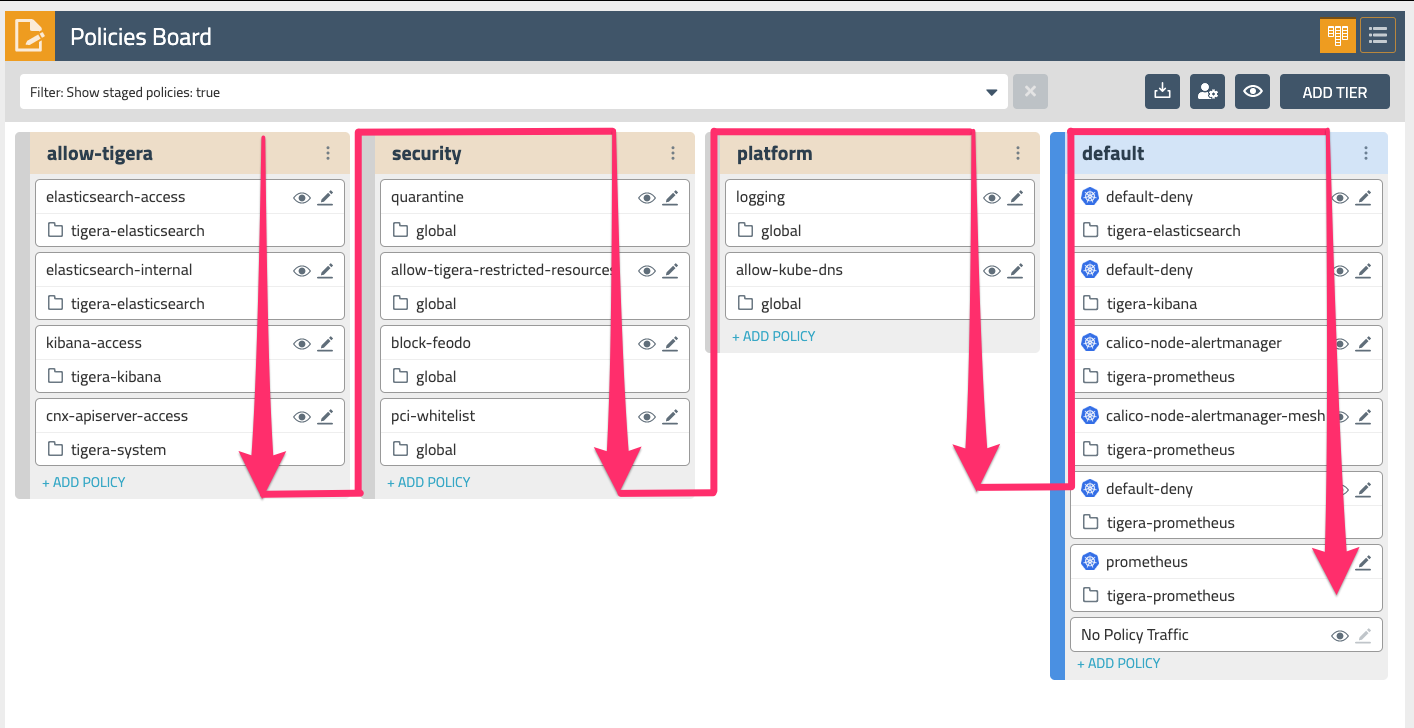
Tiers are evaluated from left to right, and network policies within tiers are evaluated from top to bottom. This effectively means that a network policy in the Security tier (Fig. 4) needs to evaluate and pass traffic before any policy below it or to the right can see that same traffic. Tiers are tied to RBAC and provide a powerful way to implement security and platform controls for your entire cluster without having to involve application teams. Your lab environment already has a few policies in the Platform and Security tiers that provide some examples of some common use cases.
Enabling Metrics
Let’s enable some additional metrics in the Policy Board so we can gain visibility into how these policies are being evaluated. In the upper right-hand corner click the “eye” icon and select “Show All” to show all the metrics on the Policy Board.
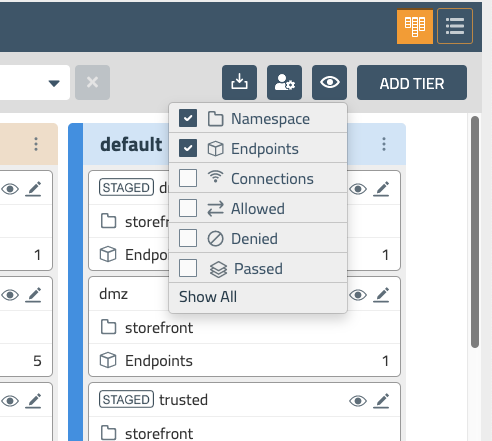
You should now see an additional set of metrics for each policy on the Policy Board - Connections, Allowed, Denied, and Passed. Passed traffic occurs in a policy that is at the end of a tier, and shows you the volume of traffic that is being passed to the next tier.
You should also see some denied traffic that is coming from the rogue pod that we deployed earlier in this lab. There are some network policies in the default tier that implement a zone-based architecture for the workloads in the storefront application - dmz, trusted, and restricted. In the next section we will take a closer look at how the rules within these policies are evaluating network traffic.
Policy View Metrics
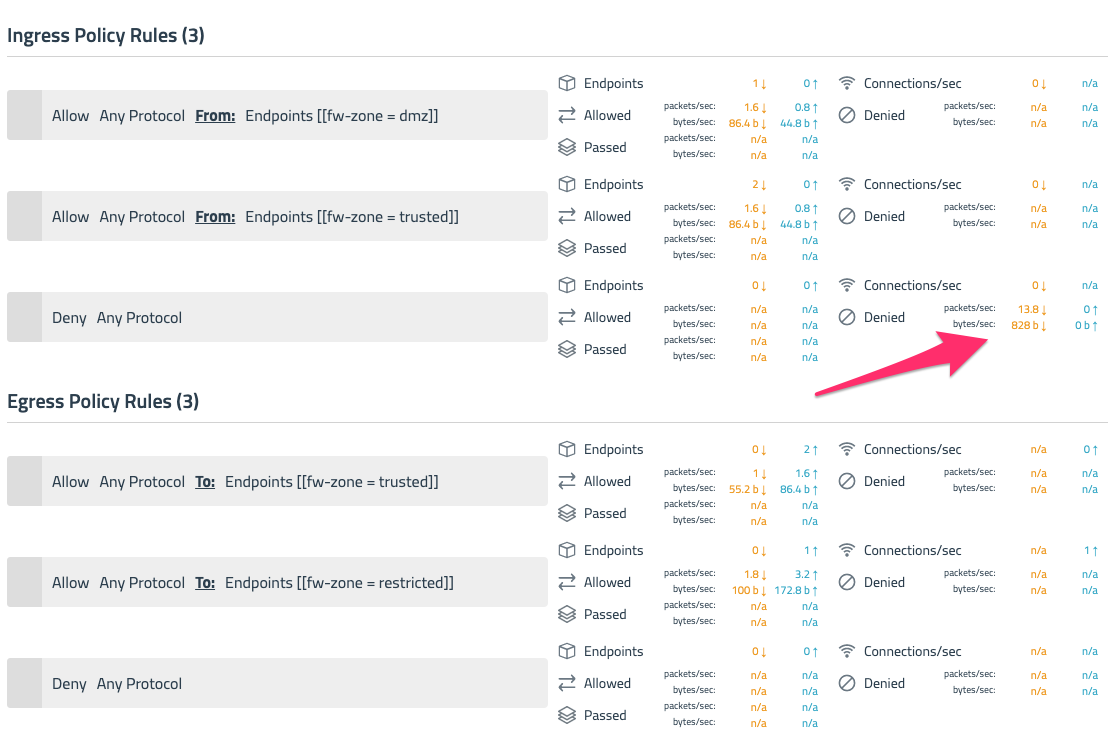
Let’s take a closer look at the denied traffic in the default.trusted policy by selecting the view/eye icon. Looking at a single policy, you can see the level of detailed visibility that Calico Enterprise provides on a per rule basis. This policy allows ingress traffic from dmz, allows workloads within the trusted zone to communicate with each other, and allows egress traffic out to the restricted zone.
The metrics displayed alongside policy rules makes it easy to diagnose issues with network policies and denied traffic. In this case, we can see that denied traffic is on the ingress rules of this policy because the rogue pod we deployed is not part of the dmz or trusted zones.
Using Flow Logs
While the Policy Board and Flow Visualizer provide powerful ways to understand the traffic flows within your cluster, there can be situations where you need to access a greater level of detail to troubleshoot network connectivity issues. Let’s take a look “under the hood” at some of the raw flow log data that Calico Enterprise can generate.
- In the Calico Enterprise UI, select Kibana from the left navigation menu and login using the Kibana user credentials that were provided as part of your lab setup. Calico Enterprise includes a fully integrated deployment of Elastic to collect flow log data that drives a number of key capabilities like the Flow Visualizer, metrics in the dashboard and Policy Board, policy automation and testing features, and compliance and security.
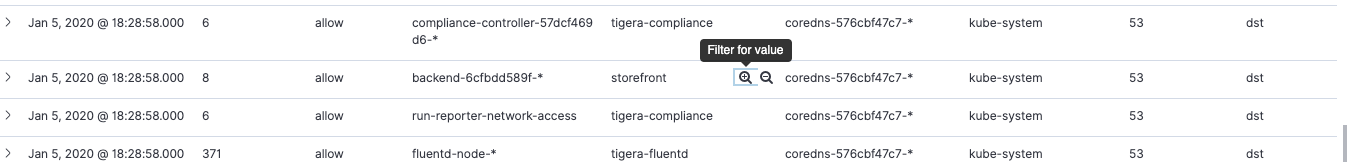
- Select Dashboard from the left navigation menu and then scroll down to see a tabular view of flow log data that has been generated by Calico Enterprise. Kibana provides its own set of powerful filtering capabilities to quickly drill into this data. Mouse over the
source_namespacecolumn and select the ‘Filter for value’ icon next to one of the rows for storefront. Repeat this same selection fordest_namespace.
Now we are just looking at the flow log data within our storefront application. Expand one of these rows using the caret/arrow on the far left hand side.
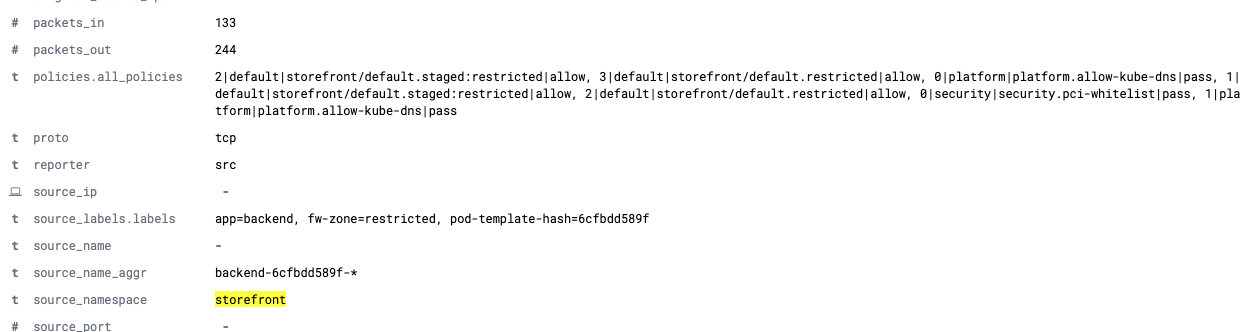
Take some time to review all of the fields that are provided in a single flow log entry. While there are over 30 different fields in each entry, some of the most useful in the context of troubleshooting are the following:
source_name_aggranddest_name_aggrprovide the pod prefix for the aggregated flows between workloads, making it easy to make sense of endpoints that may be backed by replica setspolicies.all_policiesshows the tier order|tier|policy that applied to this flow and the result of evaluation - allow, deny, or passsource_labels.labelsanddest_labels.labelswhich lists the Kubernetes labels that apply to the respective source and destination endpoints
These raw flow logs, with all of the Kubernetes context included, provides yet another valuable tool to gain visibility into your cluster and quickly make sense of network traffic to troubleshoot and diagnose issues.
Wrapping up
One of the most foundational components to operating your Kubernetes platform is having tools that allow you to gain visibility into a cluster and understand how workloads are communicating with each other. In this lab, you used the capabilities of Calico Enterprise to visualize network traffic with the Flow Visualizer, understand policy evaluation with metrics in the Policy Board and policy editor, and took a look “under the hood” to see how much Kubernetes context that is preserved in flow logs - all of which help you troubleshoot and diagnose issues more quickly.
Stick around and feel free to explore Calico Enterprise in your lab setup.