Inspect the HTTP Request
This workshop has been deprecated and archived. The new Amazon EKS Workshop is now available at www.eksworkshop.com.
Pixie automatically traces the full request/response bodies of application w for the following supported protocols. Let’s use Pixie to see the contents of this failed HTTP request.
Inspect the HTTP Request
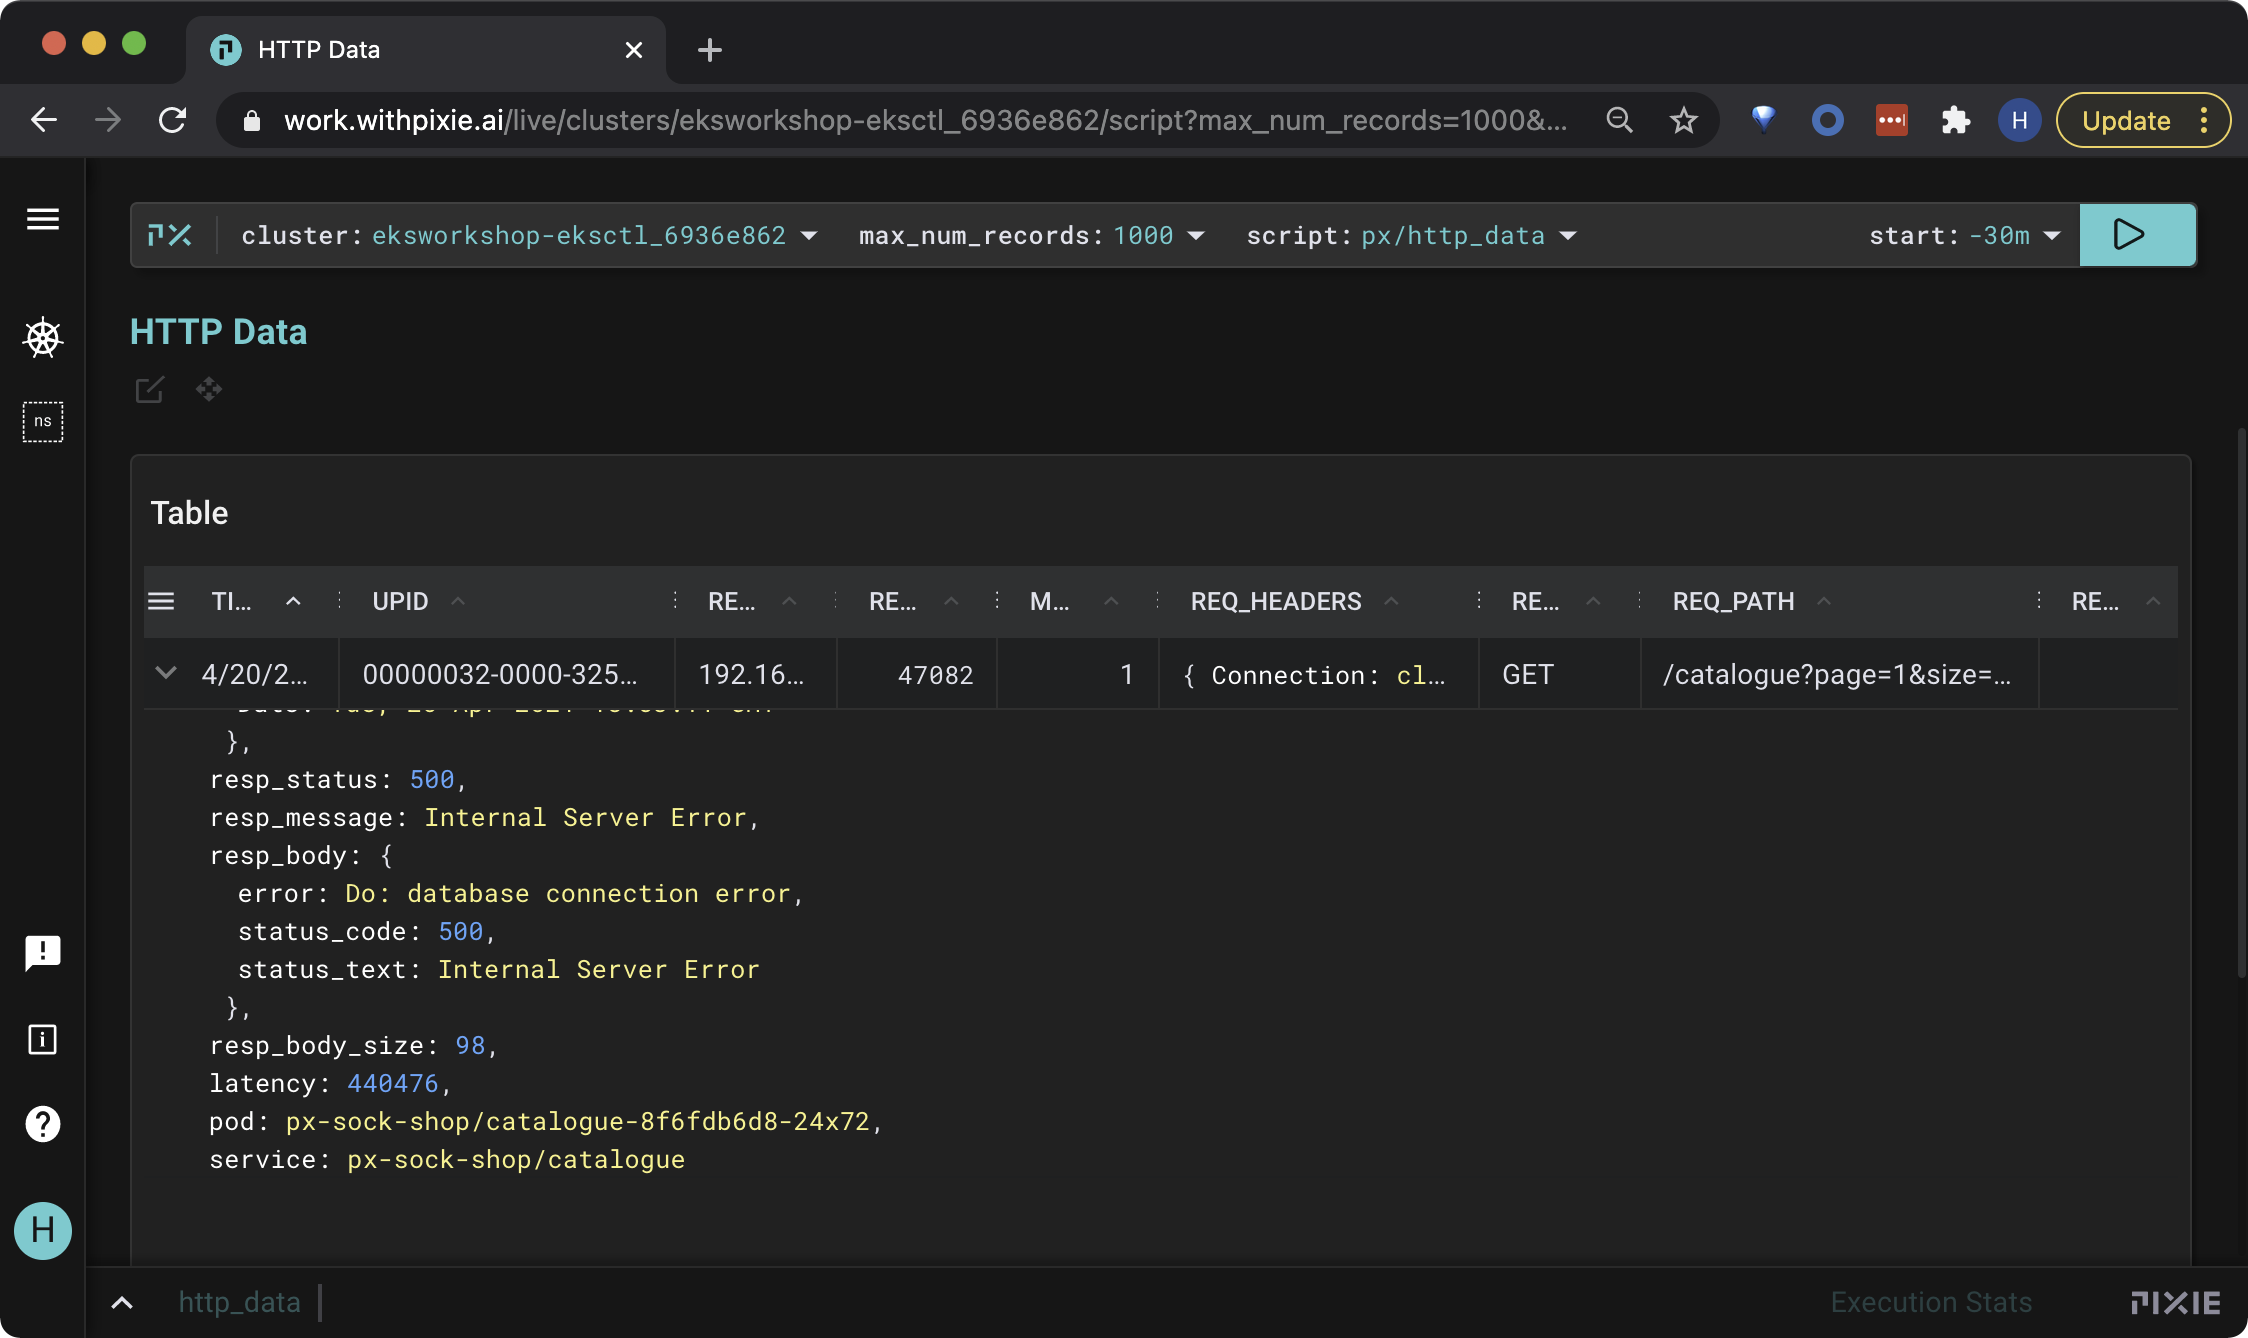
Select the px/http_data script from the script drop-down menu. Change the start_time to -30m or any window that will include when you triggered the bug in the Sock Shop app.
This script shows the traced HTTP1/2 requests made within your cluster, as long as the request either originates or is received inside of your cluster. There is quite a bit of HTTP traffic in this cluster, so let’s filter it to only show errors.
Open the script editor using ctrl+e (Windows, Linux) or cmd+e (Mac). Or by clicking on the edit script button circled in red below.
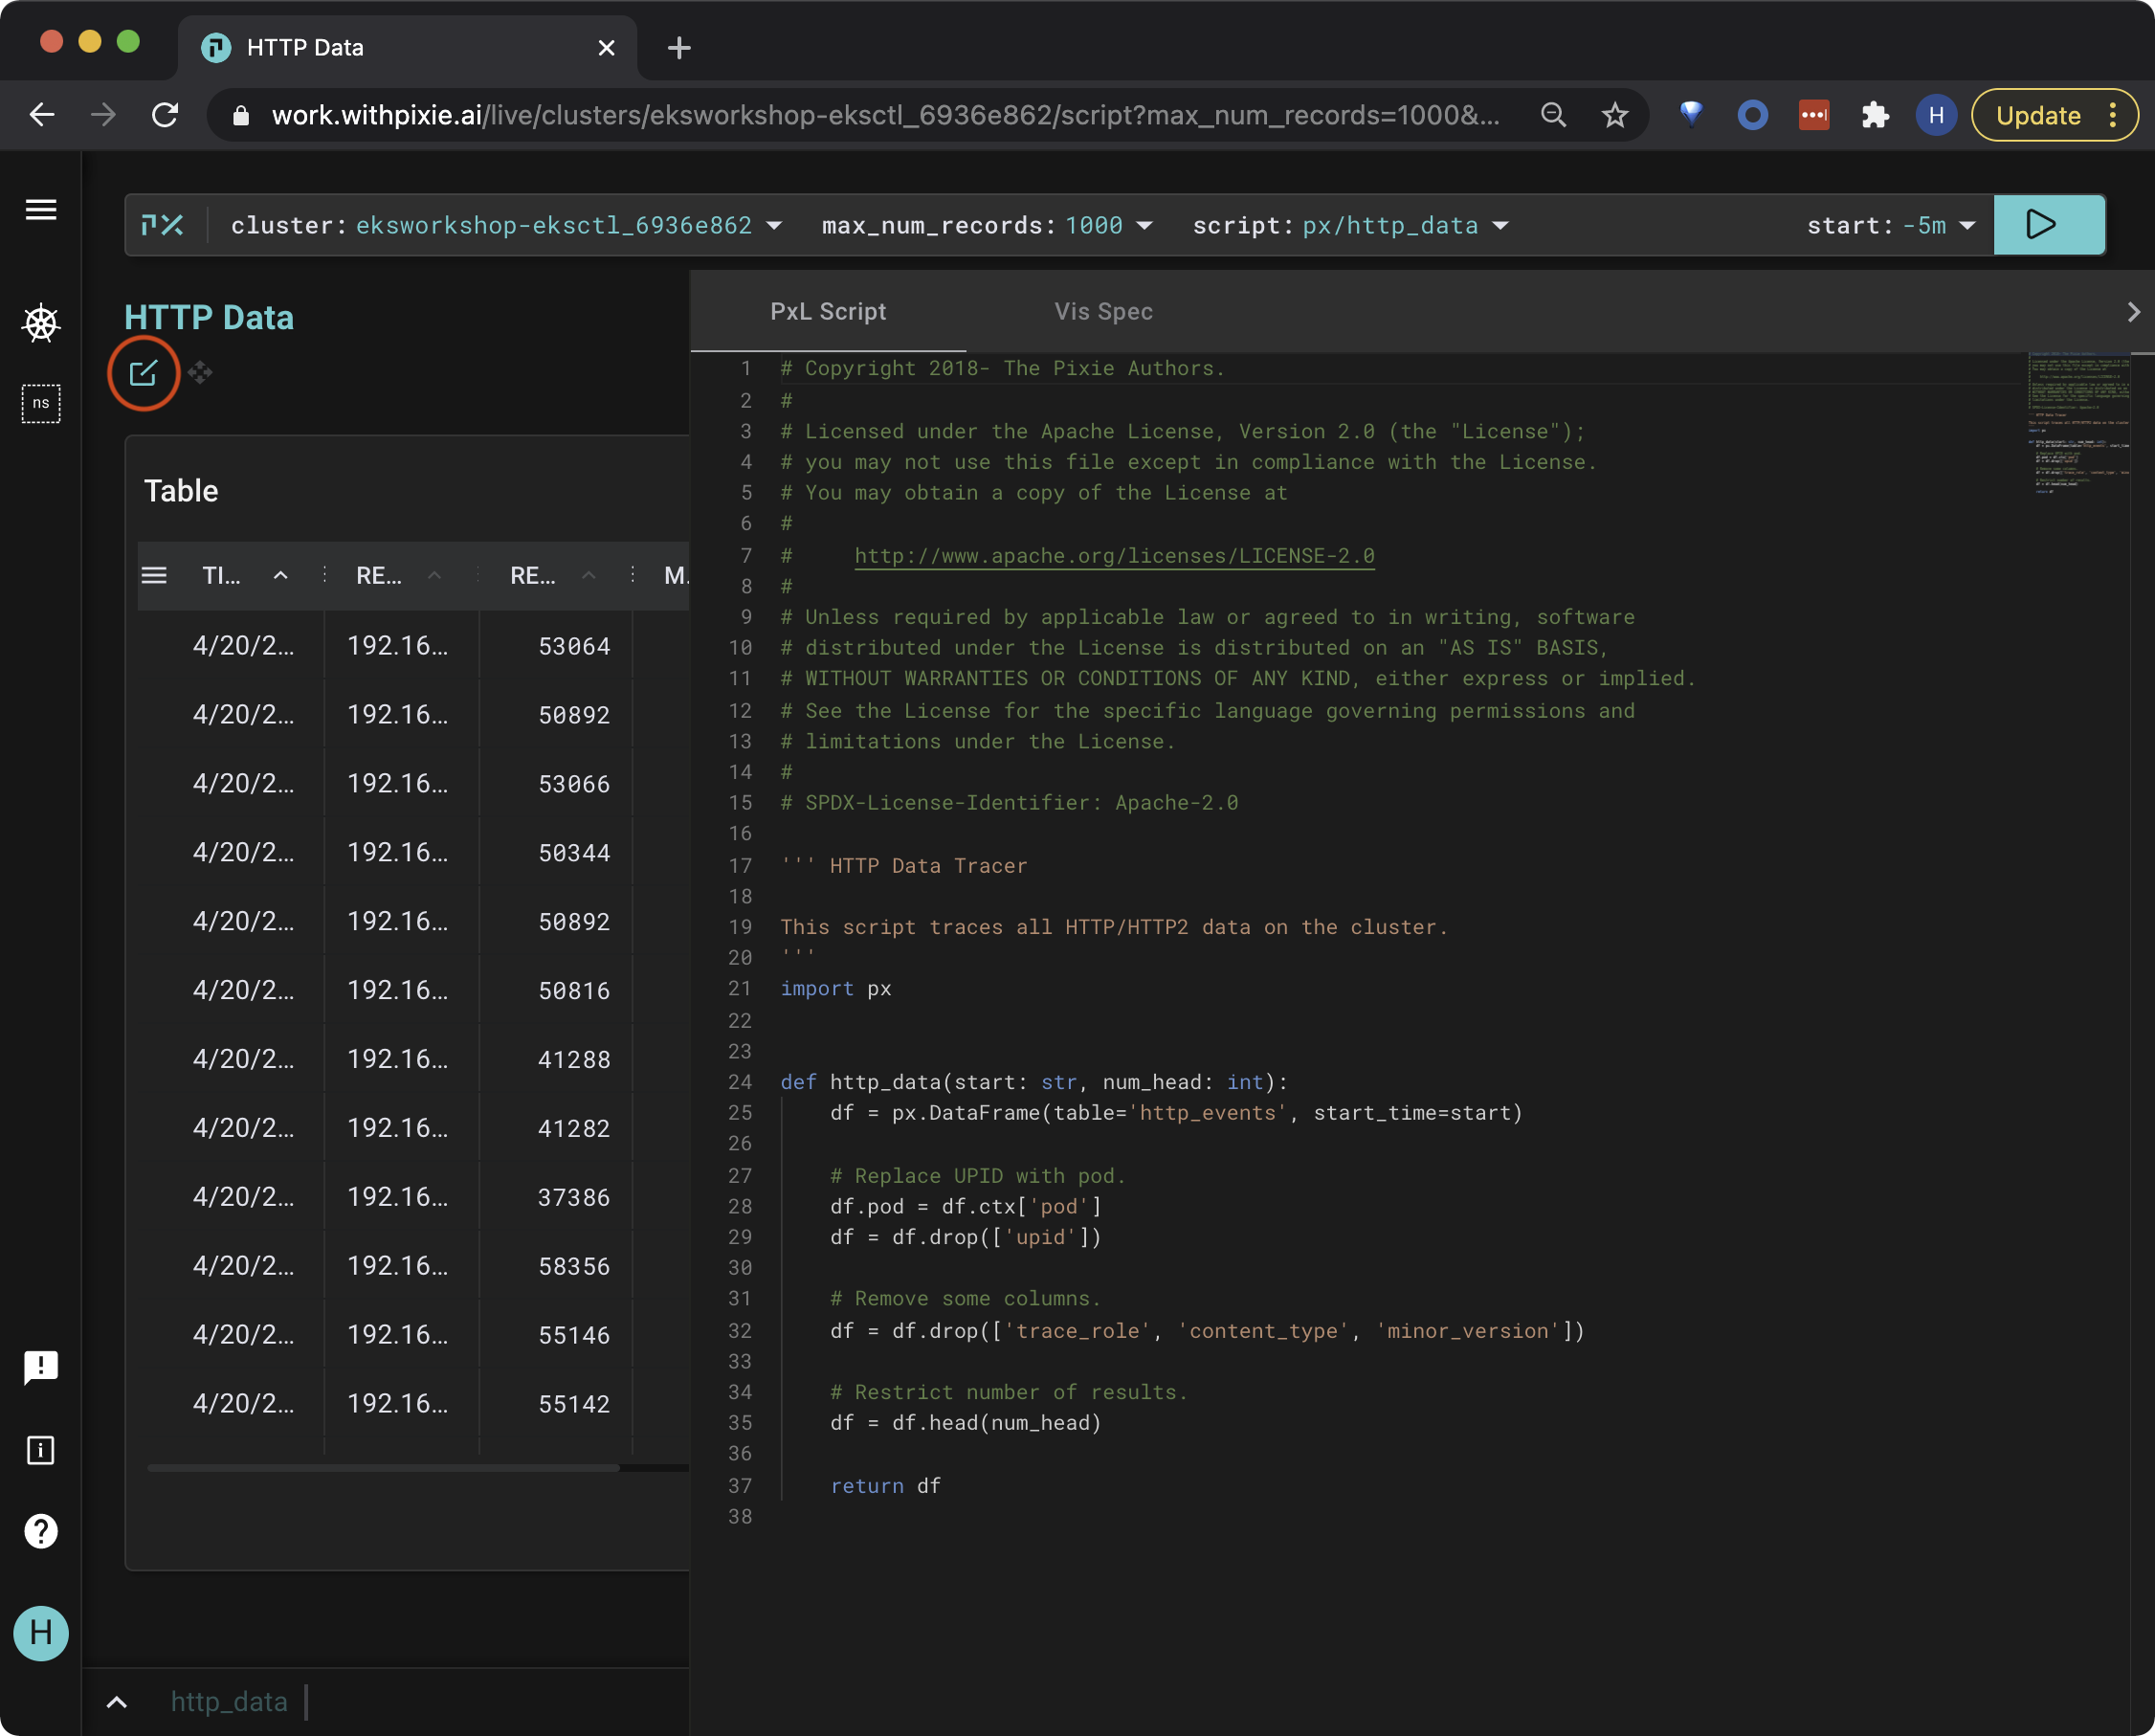
Delete line 29 df.node = df.ctx['node'] and replace it with the following.
    # Access the service name.
    df.service = df.ctx['service']

    # Filter to only catalogue service.
    df = df[df.service == 'px-sock-shop/catalogue']

    # Filter to errors greater or equal to 400.
    df = df[df.resp_status >= 400]
Make sure that the new lines just added match the indentation of the existing lines. If not, you will get an invalid syntax error when running the script.
This code accesses the service of the pod receiving HTTP request. Then, it filters the requests to only include those made by the catalogue service that have an error code.
Pixie specifies services and pods with the namespace prepended. For example, the catalogue service in the px-sock-shop namespace looks like px-sock-shop/catalogue.
Re-run the script with the RUN button (top right of the page), or using the keyboard shortcut: ctrl+enter (Windows, Linux) or cmd+enter (Mac).
Hide the script editor using the same command to show it: ctrl+e (Windows, Linux) or cmd+e (Mac).
The output shows the request with the error you recently triggered. Click on a row to inspect the row data in json format. Scroll down to the resp_body json key and you can see that our error is a database connection error.