Dashboards
This workshop has been deprecated and archived. The new Amazon EKS Workshop is now available at www.eksworkshop.com.
Log in to Grafana
Log in to Grafana dashboard using credentials supplied during configuration.
You will notice that ‘Install Grafana’ & ‘create your first data source’ are already completed. We will import community created dashboard for this tutorial.
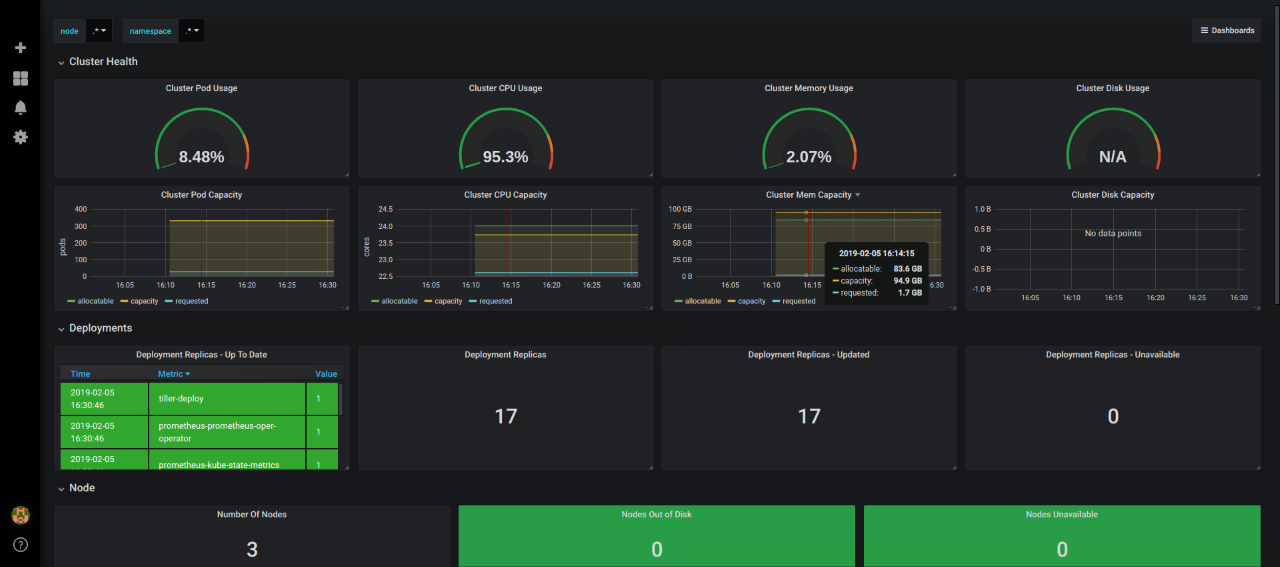
Cluster Monitoring Dashboard
For creating a dashboard to monitor the cluster:
- Click '+' button on left panel and select ‘Import’.
- Enter 3119 dashboard id under Grafana.com Dashboard.
- Click ‘Load’.
- Select ‘Prometheus’ as the endpoint under prometheus data sources drop down.
- Click ‘Import’.
This will show monitoring dashboard for all cluster nodes
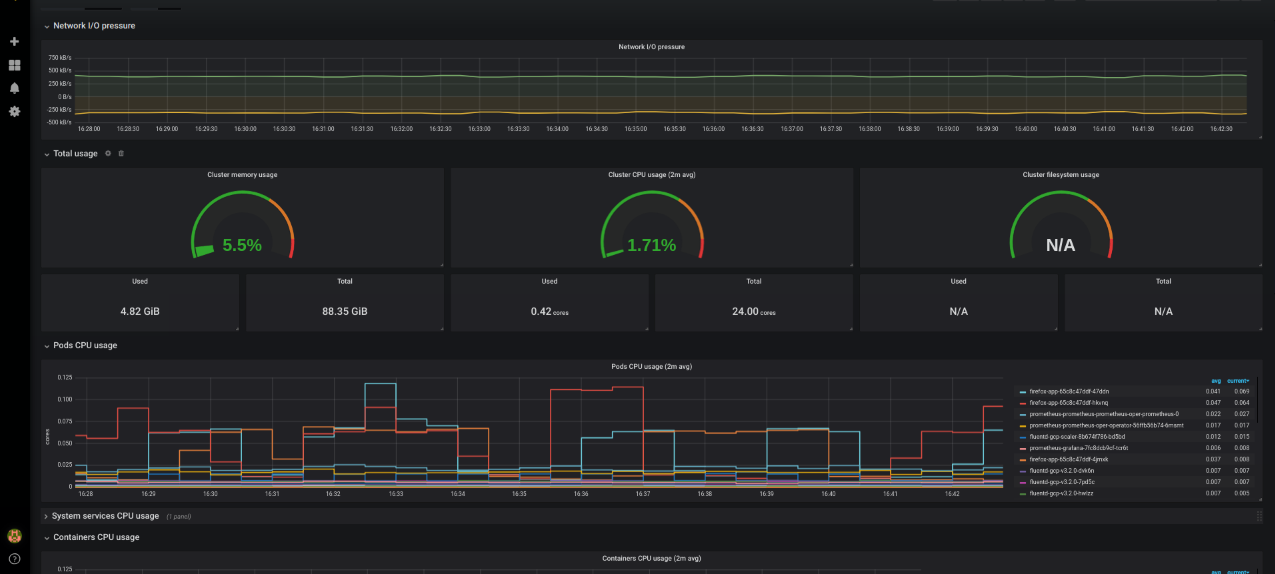
Pods Monitoring Dashboard
For creating a dashboard to monitor all the pods:
- Click '+' button on left panel and select ‘Import’.
- Enter 6417 dashboard id under Grafana.com Dashboard.
- Click ‘Load’.
- Enter Kubernetes Pods Monitoring as the Dashboard name.
- Click change to set the Unique identifier (uid).
- Select ‘Prometheus’ as the endpoint under prometheus data sources drop down.s
- Click ‘Import’.