Using CloudWatch Alarms
This workshop has been deprecated and archived. The new Amazon EKS Workshop is now available at www.eksworkshop.com.
You can use the CloudWatch metrics to generate various alarms for your EKS Cluster based on assigned metrics.
In CloudWatch Container Insights we’re going to drill down to create an alarm using CloudWatch for CPU Utilization of the Wordpress service.
To do so:
- Click on the three vertical dots in the upper right of the CPU Utilization box.
- Select View in Metrics.
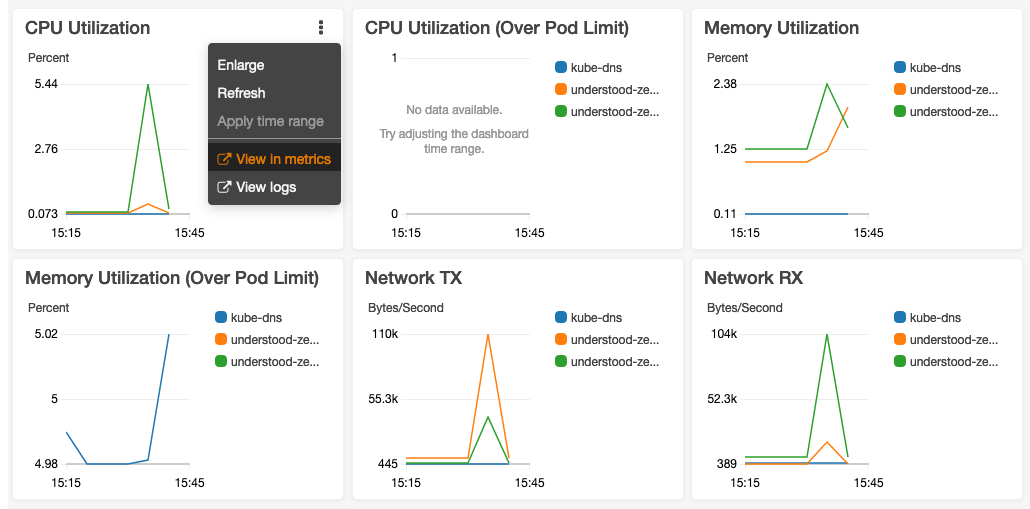
This will isolate us to a single pane view of CPU Utilization for the eksworkshop-eksctl cluster.
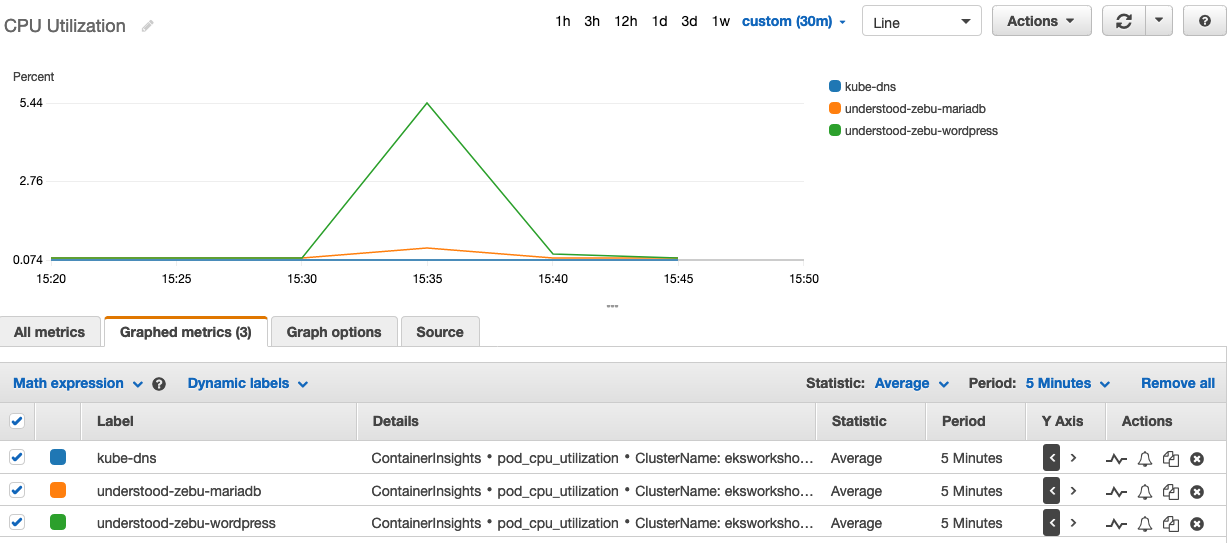
From this window we can create alarms for the understood-zebu-wordpress service so we know when it’s under heavy load.
For this lab we’re going to set the threshold low so we can guarantee to set it off with the load test.
To create an alarm, click on the small bell icon in line with the Wordpress service. This will take you to the metrics alarm configuration screen.
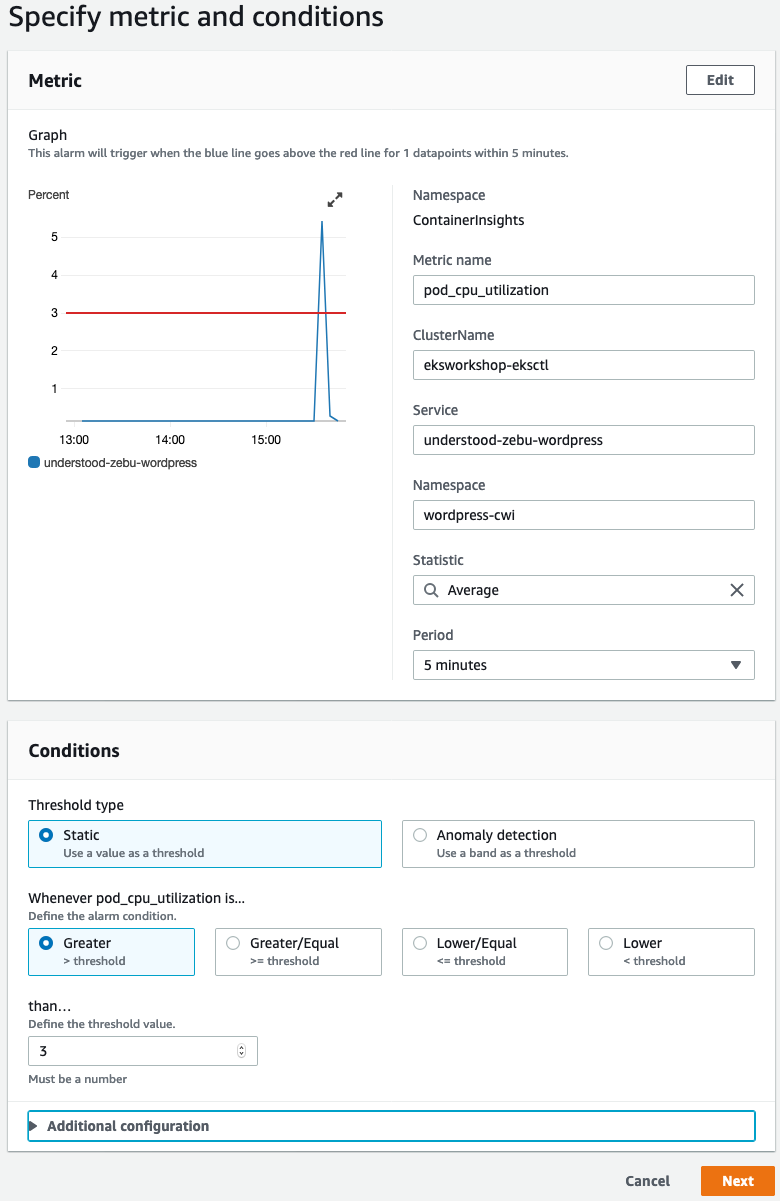
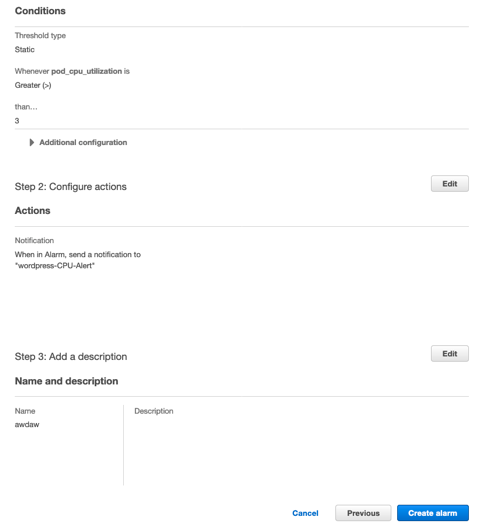
As we can see from the screen we peaked CPU at over 6 % so we’re going to set our metric to 3% to assure it sets off an alarm. Set your alarm to 50% of whatever you max was during the load test on the graph.
Click next on the bottom and continue to Configure Actions.
We’re going to create a configuration to send an SNS alert to your email address when CPU gets above your threshold.
On the Configure Action screen:
- Leave default of in Alarm.
- Select Create new topic under Select and SNS Topic.
- In Create new topic… name it wordpress-CPU-alert.
- In Email Endpoints enter your email address.
- Click create topic.
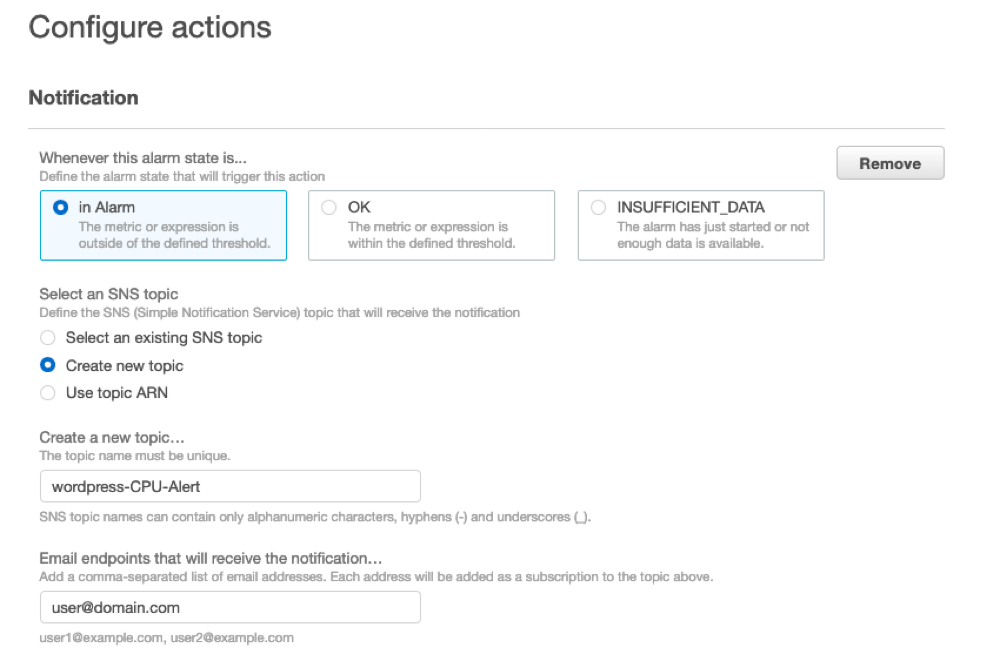
Once those items are set, click the Create topic and you can click Next at the bottom of the screen.
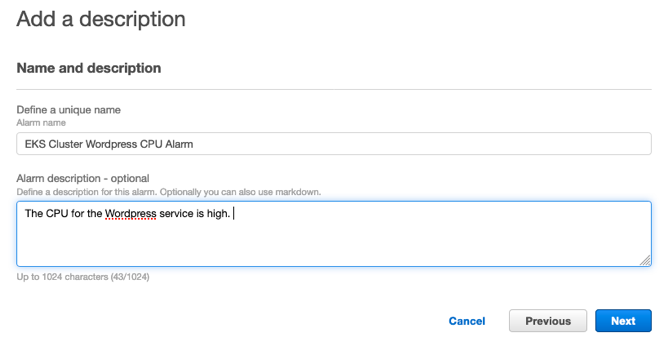
On the next screen we’ll add a unique name for our alert, and press Next.
The next screen will show your metric and the conditions. Make sure to click create alarm.
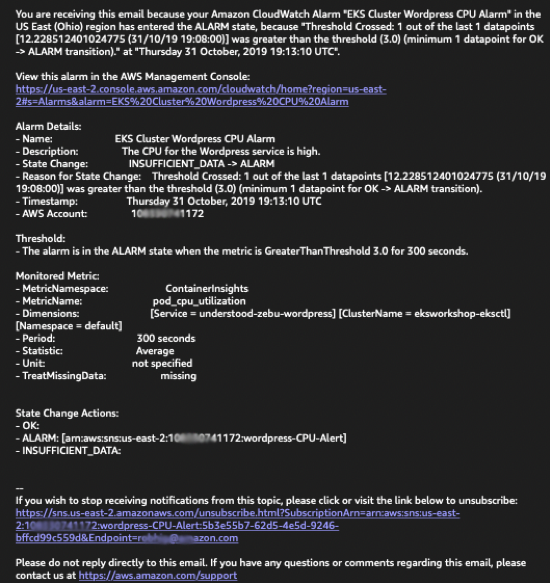
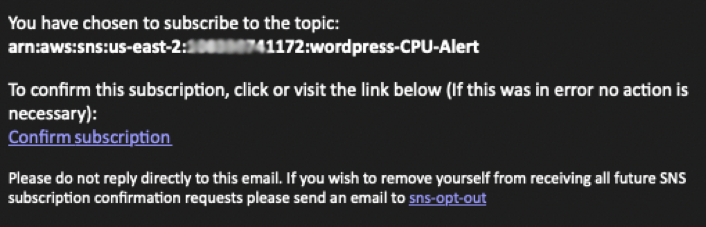
After creating your new SNS topic you will need to verify your subscription in your email.
Testing your alarm
For the last step of this lab, we’re going to run one more load test on our site to verify our alarm triggers. Go back to your Cloud9 terminal and run the same commands we can previously to load up our Wordpress site.
i.e.
export WP_ELB=$(kubectl -n wordpress-cwi get svc understood-zebu-wordpress -o jsonpath="{.status.loadBalancer.ingress[].hostname}")

siege -q -t 15S -c 200 -i ${WP_ELB}
In a minute or two, you should receive and email about your CPU being in alert. If you don’t verify your SNS topic configuration and that you’ve accepted the subscription to the topic.