Viewing our collected metrics
This workshop has been deprecated and archived. The new Amazon EKS Workshop is now available at www.eksworkshop.com.
Now let’s navigate back to CloudWatch Container Insights browser tab to view the data we’ve generated.
From here you can choose a number of different views. We’re going to narrow down our timelines to a custom time range of just 30 minute so we can zoom into our recently collected insights.
To do so go to the Time Range option at the top right of The CloudWatch Container Insights windows and selecting 30 minutes.
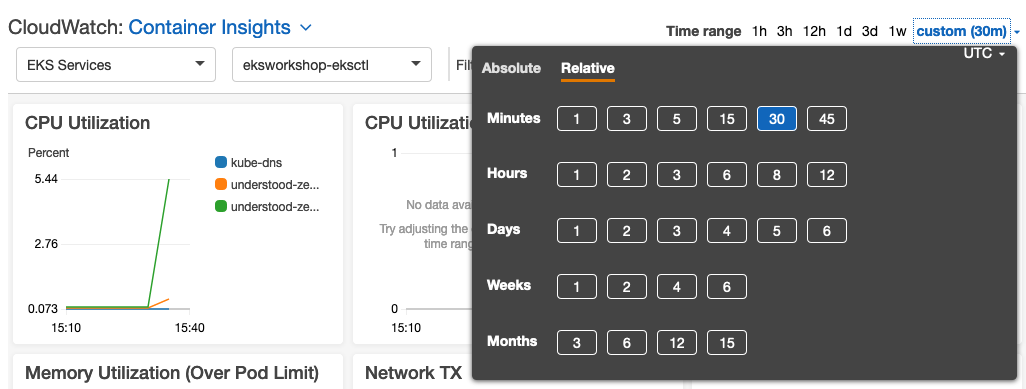
Once zoomed in on the time frame we can see the large spike in resource usage for the load we just generated to the Wordpress service in our EKS Cluster.
 As mentioned previous you can view some different metrics based on the Dropdown menu options. Let’s take a quick look at some of those items.
