Implementing Existing Security Controls in Kubernetes
This workshop has been deprecated and archived. The new Amazon EKS Workshop is now available at www.eksworkshop.com.
Getting Started
Before you go any further, please remember to type lab3 set_up in the terminal to set up the environment for this lab.
Introduction
In this lab, you will learn how Calico Enterprise makes it easy for security and compliance teams to extend existing enterprise controls to Kubernetes. The dynamic nature of workloads within a cluster presents a number of challenges for security and compliance practitioners. Calico Enterprise addresses these challenges with a tool set that extends Kubernetes itself and understands the declarative metadata within your cluster.
You will learn the following:
- How to use declarative and label-based Calico Network Policies to enforce zone-based controls and security requirements
- How to use Policy Tiers as way to enforce higher precedent security and compliance policies that cannot be circumvented by application and development teams
- How to define Compliance Reports that leverage Kubernetes constructs and can be run on a continuous basis in lock step with your CI/CD pipeline
- How to use audit logs to monitor and alert on changes to network policies with git-friendly diffs
Setup
For this lab, we will be using a fairly simple microservices application called storefront to understand the visibility and troubleshooting features of Calico Enterprise.
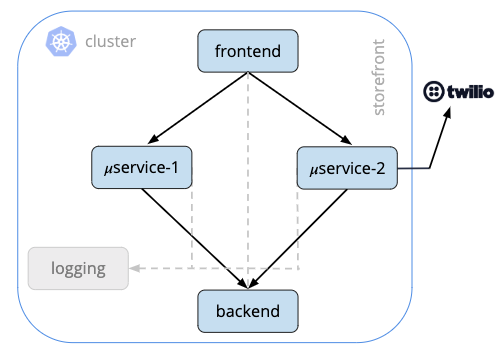
Storefront (Fig 1) is a fairly simple microservices application running in Kubernetes. It has a frontend service that handles end-user requests, communicates with two business logic services which in turn make requests to a backend service. All of these containers communicate with a logging service and one of the business logic services, microservice 2, makes external requests to Twilio to provide some telephony for this application.
- Let’s quickly take a look at the pods (and their labels) running in the storefront namespace
kubectl get pods -n storefront --show-labels

NAME                            LABELS
backend-55f7dc6b68-8n9cc       app=backend,fw-zone=restricted,pod-template-hash=55f7dc6b68
frontend-6d996fbd97-9g92v  app=frontend,fw-zone=dmz,pod-template-hash=6d996fbd97
logging-7bc4bfcff5-5x49j          app=logging,pod-template-hash=7bc4bfcff5
microservice1-7599d8d8f-4mc98   app=microservice1,fw-zone=trusted,pod-template-hash=7599d8d8f
microservice2-fddf7cff8-fggd2  app=microservice2,fw-zone=trusted,pod-template-hash=fddf7cff8
Notice that there are some existing labels on the pods that make up our storefront application. Later in this lab we will use these labels to implement network policies in Calico Enterprise. But before we do that, we need to quickly understand how Policy Tiers work in Calico Enterprise.
Using the Policy Board
The Policy Board can provide a useful way to understand how policies are being evaluated across policy tiers on network flows in the cluster.
- Login to the Calico Enterprise UI and select Policies from the left navigation menu. Here you will see the Policy Board with all of the network policies defined within the cluster and how they map to policy tiers.
Policy Tiers
Calico Enterprise makes it easy to define the “guard rails” for your Kubernetes platform through the use of Policy Tiers. Policy Tiers allow platform engineering and security teams to enforce network policies that take precedence over those defined for specific applications like storefront.
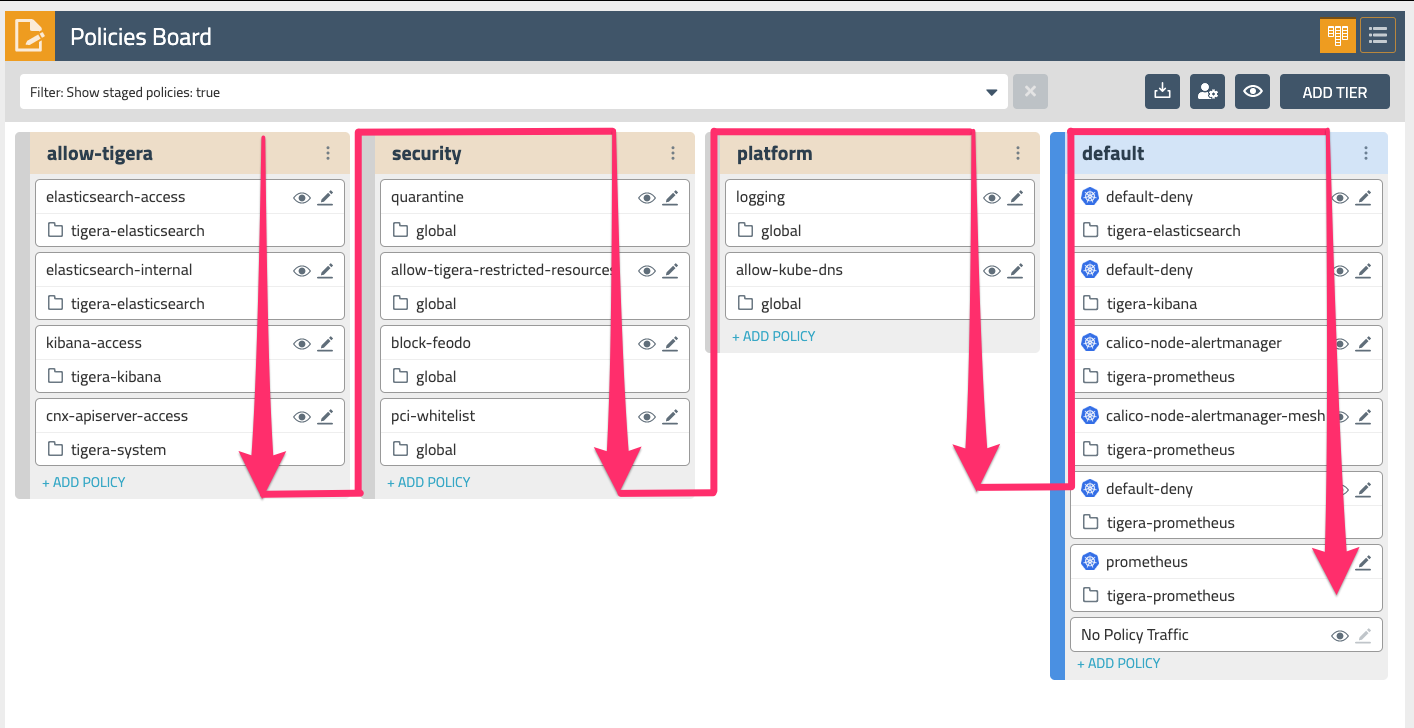
Tiers are evaluated from left to right, and network policies within tiers are evaluated from top to bottom. This effectively means that a network policy in the Security tier (Fig. 2) needs to evaluate and pass traffic before any policy below it or to the right can see that same traffic. Tiers are tied to RBAC and provide a powerful way to implement security and platform controls for your entire cluster without having to involve application teams. Your lab environment already has a few policies in the platform and security tiers that provide some examples of some common use cases. Policies specific to an application would typically go in the default tier.
In the next section, we will begin to implement policies in the default tier for our storefront application.
Implementing Zone-based Network Policies
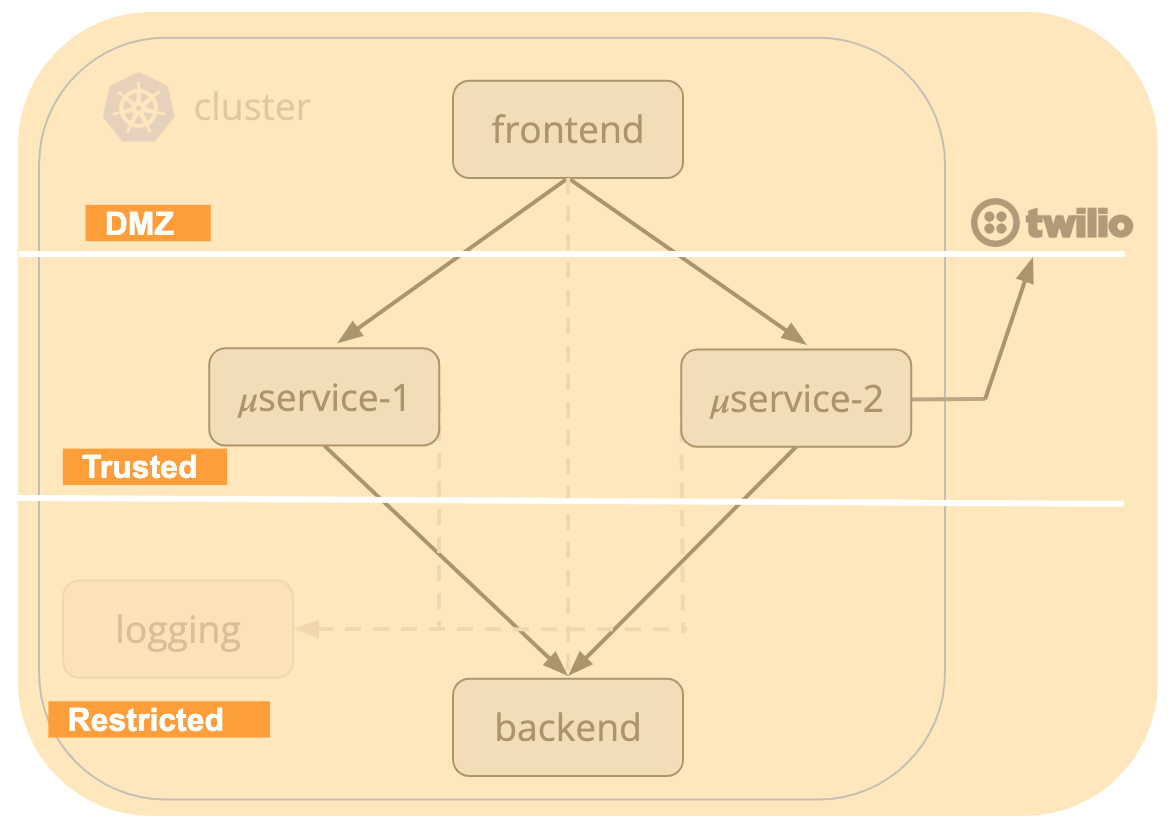
One of the most widely adopted deployment models with traditional firewalls is using a zone-based architecture. This involves putting the frontend of an application in a DMZ, business logic services in Trusted zone, and our backend data store in Restricted - all with controls on how zones can communicate with each other. For our storefront application, it would look something like the following:
Using the labels that already exist on our pods, let’s start by creating a network policy for the DMZ zone. Select Policies from the left navigation menu. Then select +ADD POLICY at the bottom of the default tier.
DMZ zone
-
Create a DMZ policy with the following attributes:
- Name the policy dmz and insert before
tigera-compliance.default-deny - Set the Scope to Namespace = storefront
- In the Applies To section, add a label selector for
fw-zone=dmz - Under Type select both Ingress and Egress
- Name the policy dmz and insert before
-
Add the following Ingress rules:
- Allow - Any protocol - From: Endpoint selector
type=public - Deny - Any protocol
- Allow - Any protocol - From: Endpoint selector
-
Add the following Egress rules:
- Allow - Any protocol - To: Endpoint selector
fw-zone=trustedORapp=logging - Deny - Any protocol
- Allow - Any protocol - To: Endpoint selector
-
Save the policy by selecting Enforce
The storefront.dmz policy you just created should be at the top of the default tier. If for some reason it is not, you can drag the policy to the top to change its order within the tier.
Trusted zone
- Now let’s +ADD POLICY again and create a Trusted policy with the following attributes:
- Name the policy trusted and choose to add after
storefront.dmz - Set the Scope to Namespace = storefront
- In the Applies To section, add a label selector for
fw-zone=trusted - Under Type select both Ingress and Egress
- Add the following Ingress rules:
- Allow - Any protocol - From: Endpoint selector
fw-zone=dmzORfw-zone=trusted - Deny - Any protocol
- Allow - Any protocol - From: Endpoint selector
- Add the following Egress rules:
- Allow - Any protocol - To: Endpoint selector
fw-zone=restricted - Deny - Any protocol
- Allow - Any protocol - To: Endpoint selector
- Name the policy trusted and choose to add after
- Save the policy by selecting Enforce
Restricted zone
- Finally, let’s create a Restricted policy with the following attributes:
- Name the policy restricted and choose to add after
storefront.trusted - Set the Scope to Namespace = storefront
- In the Applies To section, add a label selector for
fw-zone=restricted - Under Type select both Ingress and Egress
- Add the following Ingress rules:
- Allow - Any protocol - From: Endpoint selector
fw-zone=trustedORfw-zone=restricted - Deny - Any protocol
- Allow - Any protocol - From: Endpoint selector
- Add the following Egress rules:
- Allow - Any protocol
- Name the policy restricted and choose to add after
- Save the policy by selecting Enforce
The three policies we just created implement the controls that govern how workloads can communicate within and across each of these zones. As we add new microservices to storefront, placement within one of these zones is as simple as assigning the appropriate label to a pod.
- Check your work by going to the Dashboard in the left navigation menu and verify that the per policy bar graph is only showing green for allowed traffic, and not red for denied traffic. If there is a policy that is denying traffic, revisit that policy and view the real-time metrics for each rule to determine the source of your denied traffic.
Network Sets
In the DMZ policy, we used a label type=public in the Ingress rule. This label references a Calico resource called a Network Set. Network Sets allow you to create long lists of CIDRs, IPs, or domains and abstract them with a label that can be referenced in network policies. The lab setup has an existing Network Set for all public IP CIDRs (“type=public”). Feel free to explore additional network sets under the left navigation menu.
Enforcing Compliance with Network Policies
As we touched on earlier, Policy Tiers can be a useful tool for defining the “guard rails” for your entire Kubernetes platform. This allows operators to define security and compliance controls without having to interfere with the work of application developers. Given that tiers can also be controlled via RBAC, it also ensures that developers cannot inadvertently circumvent these controls. In this section we will leverage Policy Tiers and Calico’s ability to reference service accounts in network policies to implement controls for PCI compliance in our storefront application - or really any application in the cluster.
Service Accounts
Calico network policies can be applied to endpoints using selectors that match labels on the endpoint, the endpoint’s namespace, or the endpoint’s service account. By applying selectors based on the endpoint’s service account, you can use Kubernetes RBAC to control which users can assign labels to service accounts. This allows you to separate groups who can deploy pods from those who can assign labels to service accounts.
For the purposes of this lab, we have already setup each of our microservices with service accounts. Service accounts with privileges to access workloads with payment card data have been labeled as “PCI=true”.
Let’s create a network policy that will enforce that pods cannot communicate across the regulatory boundary we have setup with our PCI-labeled service accounts.
- Visit the Policy Board and select +ADD POLICY at the bottom of the security tier and create a new network policy with the following details:
- Name the policy
pci-whitelistand insert beforeglobal.pass - Scope of the policy should be Global
- In the Applies To section, use the service account label selector of PCI=true
- In the Type section, make sure the Ingress and Egress are both selected
- Add an Ingress rule and select the ‘Advanced mode’ checkbox in the upper right
- Deny - Any Protocol - To: service account label PCI=true, From: service account label where PCI!=true
- Add an Egress rule with Pass - Any Protocol - To: Endpoint selector label
k8s-app=kube-dns - Add an Egress rule that Pass - Any Protocol - To: Endpoint selector label type=public
- Add an Egress rule and select the ‘Advanced mode’ checkbox in the upper right
- Deny - Any Protocol - To: service account label where PCI!=true, From: service account label PCI=true
- Name the policy
- Save the policy by selecting Enforce
This policy ensures that only pods with PCI-labeled service accounts can talk to each other. For traffic that does not involve a PCI-labeled service account, we use the Pass action to “pass” this traffic to the next tier of Calico network policies.
Compliance Reports
One of the challenges that many organizations face is being able to report the state of compliance across the infrastructure they use to run their business. This problem is compounded by the dynamic and ephemeral nature of Kubernetes - with new applications and services being created, deleted, and scaled in every dimension, how can organizations provide attestations as to the state of compliance?
In this section we will walk through a quick example of how to use Calico Enterprise to produce dynamic compliance reports that allow you to assess the state of compliance that is in lock step with your CI/CD pipeline.
CIS benchmarks are best practices for the secure configuration of a target system - in our case Kubnernetes. Calico Enterprise supports a number of GlobalReport types that can be used for continuous compliance, and CIS benchmarks is one of them. Below is an example report definition:
apiVersion: projectcalico.org/v3
kind: GlobalReport
metadata:
  name: daily-cis-results
  labels:
    deployment: production
spec:
  reportType: cis-benchmark
  schedule: 0 0 * * *
  cis:
    highThreshold: 100
    medThreshold: 50
    includeUnscoredTests: true
    numFailedTests: 5
    resultsFilters:
    - benchmarkSelection: { kubernetesVersion: "1.15" }
      exclude: ["1.1.4", "1.2.5"]
In the report there are a number of useful parameters, including a recurring schedule that uses standard cron syntax. These reports can also be run on-demand whenever there are changes to your Kubernetes cluster. You also have the ability to select a specific benchmark suite for your version of Kubernetes, and exclude specific benchmarks based on your environment.
-
Visit the Compliance Reports in the left navigation of the Calico Manager UI. Your lab environment already has a few instances of the
daily-cis-resultsreport that has been run, and a visual summary of the results -
Expand one of the
daily-cis-resultsrows and click the download icon on the right to see a more detailed CSV results for this report. -
Explore some of the other report types (and the detailed CSVs) that have been run in the lab setup. This includes Inventory, Network Access, and Policy Audit.
Auditing
Another important security and compliance requirement for many organizations is auditing - understanding what changed, when, and how made that change. Calico Enterprise provides detailed audit logs for all changes related to network policy and other resources associated with your Calico deployment. Let’s take a look.
-
Select Policies from the left navigation menu in the Calico Enterprise UI and go back to any one of the policies you created in the
defaulttier earlier in this lab. Edit the policy and add a label of your choice as an OR with any existing labels. Select Enforce to save and deploy the policy. -
Select the policy to edit again and scroll down to the bottom of the policy to see the
Change log. Here you can see a detailed audit log of policy changes. -
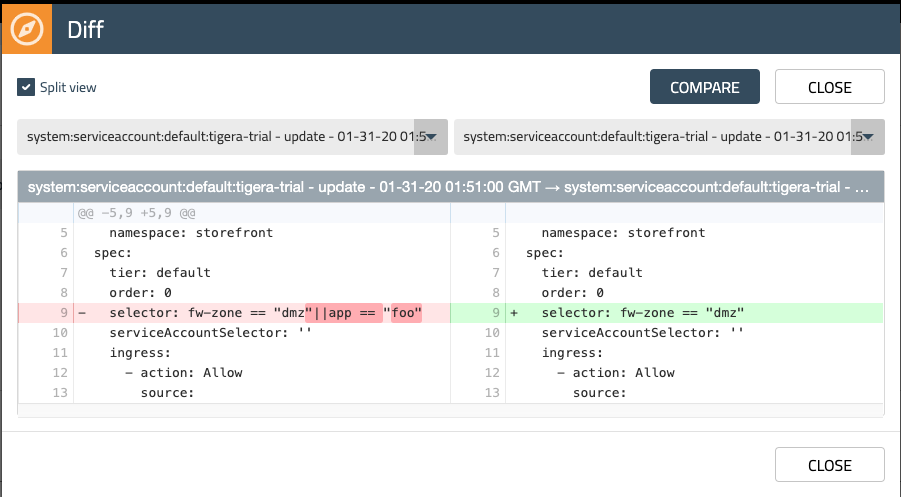
Expanding the most recent entry will show you the yaml for the version of the policy you just created, and selecting the diff button on the right will show you the git-friendly diff compared with the previous version.
-
Go back to the left navigation menu and select Kibana - now we will go take a look at all of the audit log data that Calico Enterprise generates. Select Dashboard from the left nav in Kibana and then “Tigera Secure EE Audit Logs”
-
Explore some of the audit log entries in Kibana and the detail that is provided for each entry. Any of this data can be used to generate alerts for use cases like monitoring production environments, privileged access monitoring, and many others.
Wrapping Up
One of the most fundamental components to operating your Kubernetes platform is having tools that allow you to implement the same security and compliance requirements that exist for your traditional infrastructure. In this lab, you used the capabilities of Calico Enterprise to implement zone-based policies, leverage service accounts and high precedence tiers to enforce PCI compliance, and took a look at some of the robust compliance reporting and auditing.
Stick around and feel free to explore Calico Enterprise in your lab setup.