X-Ray Console
This workshop has been deprecated and archived. The new Amazon EKS Workshop is now available at www.eksworkshop.com.
We now have the example microservices deployed, so we are going to investigate our Service Graph and Traces in X-Ray section of the AWS Management Console.
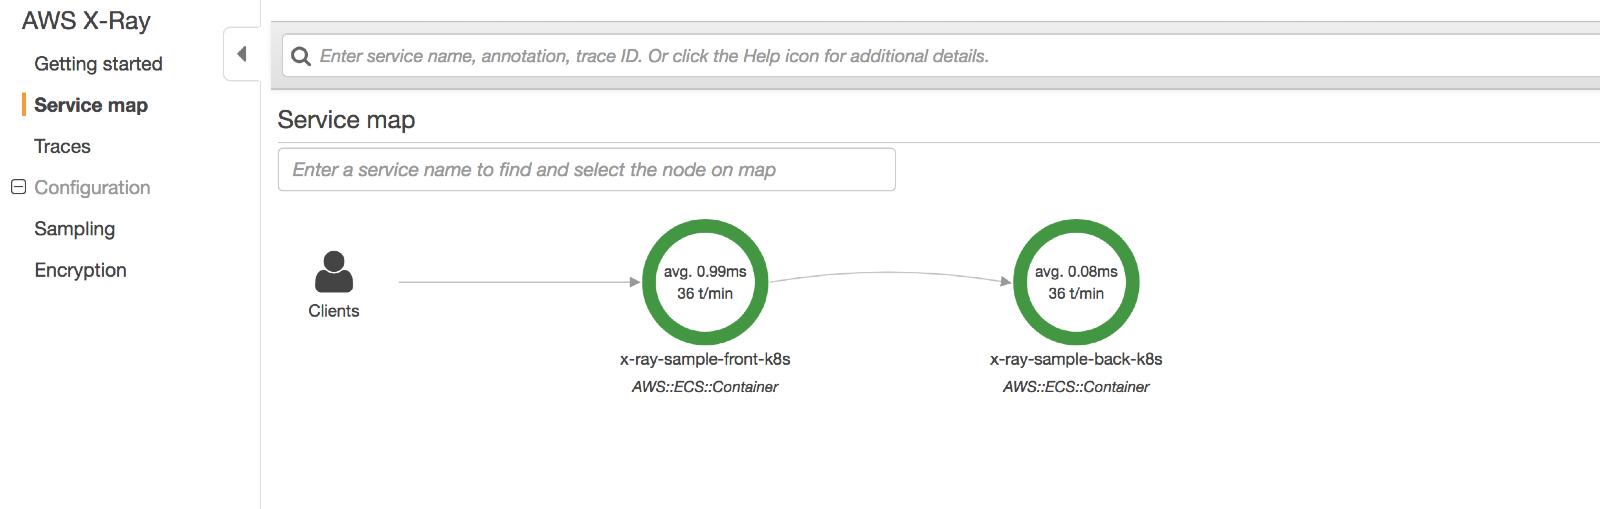
The Service map in the console provides a visual representation of the steps identified by X-Ray for a particular trace. Each resource that sends data to X-Ray within the same context appears as a service in the graph. In the example below, we can see that the x-ray-sample-front-k8s service is processing 39 transactions per minute with an average latency of 0.99ms per operation. Additionally, the x-ray-sample-back-k8s is showing an average latency of 0.08ms per transaction.
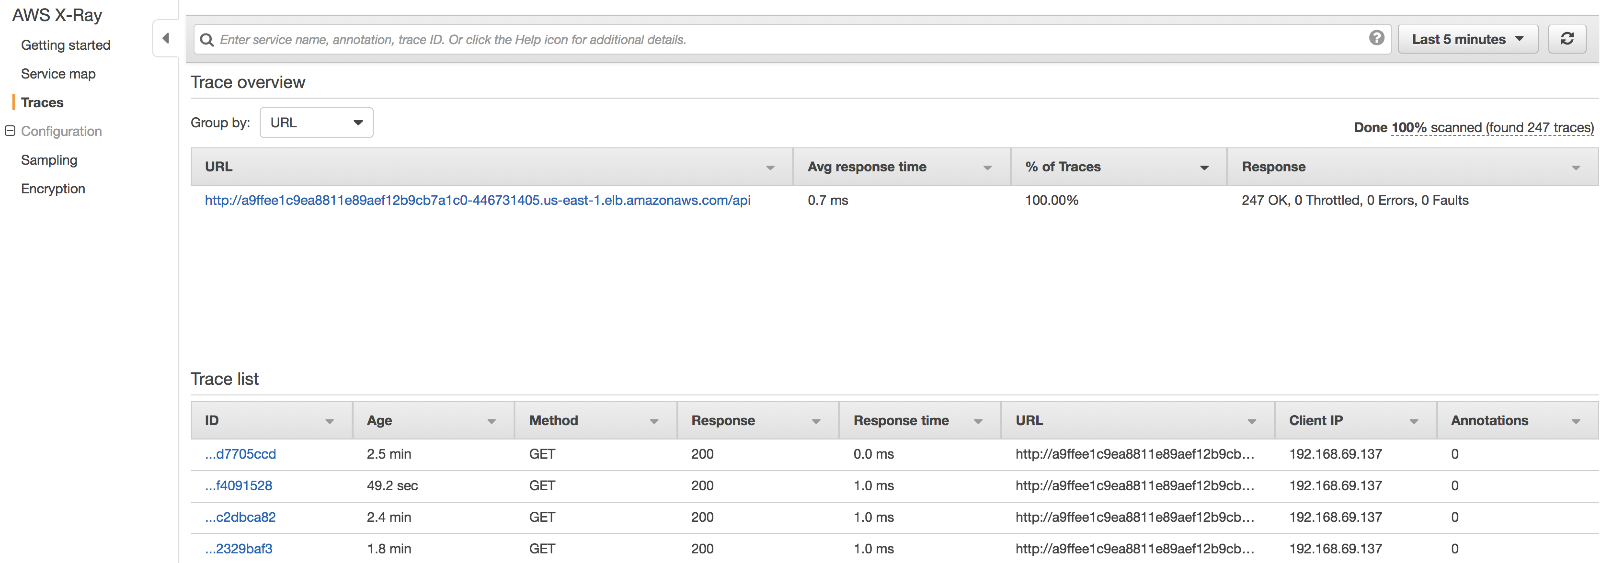
Next, go to the traces section in the AWS Management Console to view the execution times for the segments in the requests. At the top of the page, we can see the URL for the ELB endpoint and the corresponding traces below.
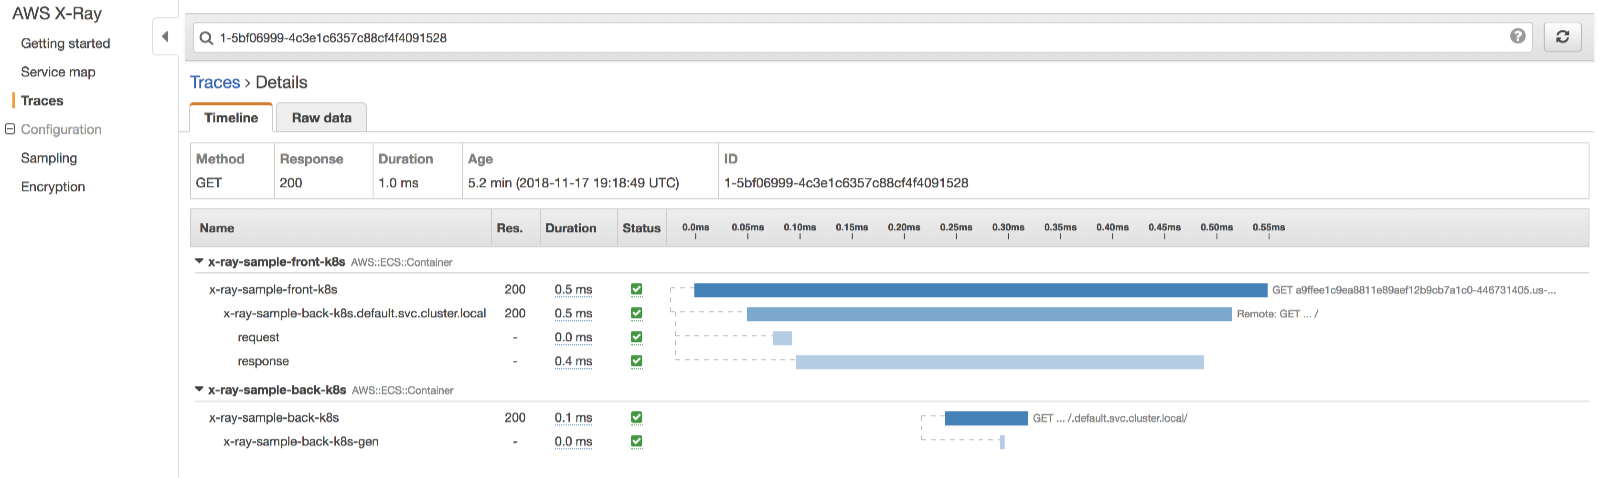
If you click on the link on the left in the Trace list section you will see the overall execution time for the request (0.5ms for the x-ray-sample-front-k8s which wraps other segments and subsegments), as well as a breakdown of the individual segments in the request. In this visualization, you can see the front-end and back-end segments and a subsegment named x-ray-sample-back-k8s-gen In the back-end service source code, we instrumented a subsegment that surrounds a random number generator.
In the Go example, the main segment is initialized in the xray.Handler helper, which in turn sets all necessary information in the http.Request context struct, so that it can be used when initializing the subsegment.
Click on the image to zoom